|
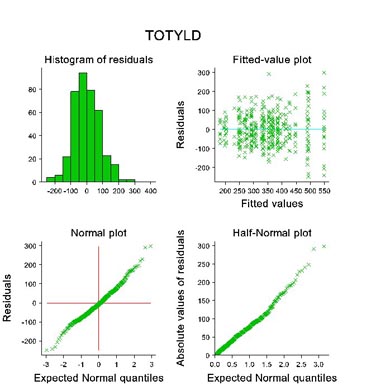
Statistical modelling Using the 'Further Output…' button we can produce summary graphs to illustrate the distributions of residuals. Relating the residuals to the fitted values (herd means) in the right upper diagram shows that herds with higher average offtakes tend also to show the greater variation among cows. The normal and half normal plots show reasonable evidence for normality in the residual distribution (curves are reasonably straight) except possibly at the tails. |
|
![]()
![]()
![]()